
Case Study 11 — Grafana TIG Stack Integration & Deployment
Grafana TIG Stack Integration & Deployment
UI Operations deployed an integrated monitoring and observability solution using Grafana, InfluxDB, and Telegraf to centralize infrastructure metrics, visualize application performance, and enable proactive alerting across cloud, on-premises, and containerized environments.
Grafana
InfluxDB
Telegraf
Infrastructure Monitoring
Project at a Glance
Client
Confidential Enterprise Client
Project
Grafana TIG Stack Integration & Deployment
Service
Infrastructure Monitoring & Operations
Platform
Grafana TIG Stack
Solution
Centralized Monitoring & Alerting
Focus
Real-Time Visibility, Scalability, Integration & Incident Response
Designed and deployed a scalable monitoring solution combining Telegraf for metrics collection, InfluxDB for time-series data storage, and Grafana for centralized dashboards and alerts. Integrated existing monitoring sources, configured notifications, and optimized data retention to improve infrastructure visibility and operational response.
The Challenge
Turning Fragmented Infrastructure Data into Actionable Operational Visibility.
The client needed a centralized way to monitor servers, applications, networks, and cloud services without switching between multiple tools.
The solution also needed to support infrastructure growth, consolidate metrics from existing systems, and notify operations teams when critical performance thresholds were exceeded.
Fragmented Monitoring
Infrastructure, application, and business metrics were distributed across different sources, limiting unified visibility.
Growing Infrastructure
Monitoring needed to scale across Windows and Linux servers, cloud services, Docker containers, and Kubernetes workloads.
Reactive Incident Detection
Operations teams needed timely alerts for CPU spikes, memory pressure, disk utilization, and service interruptions.
The Solution
One Monitoring Platform. Complete Infrastructure Visibility.
UI Operations implemented the TIG Stack—Telegraf, InfluxDB, and Grafana—to collect, store, and visualize operational metrics through centralized dashboards.
The deployment included custom dashboards, threshold-based alerts, integration with existing monitoring systems, and scalability configurations to support growing data volumes.
Telegraf Metrics Collection
Deployed agents and plugins to collect system, application, network, cloud, and container metrics.
InfluxDB Time-Series Storage
Configured time-series storage, retention policies, and performance optimization for high-volume metrics.
Grafana Visualization
Built interactive dashboards for system health, application performance, network traffic, and business KPIs.
Alerting & Tool Integration
Configured threshold alerts, notifications, and integrations with Prometheus and existing monitoring tools.
Architecture & Technology
Inside the TIG Stack Monitoring Architecture.
The solution collects metrics from infrastructure and application sources through Telegraf, stores time-series data in InfluxDB, and presents it through Grafana dashboards.
Prometheus provides an additional metrics source for Kubernetes monitoring, while notification integrations help operations teams respond to performance events.
Centralized Infrastructure Performance Dashboard
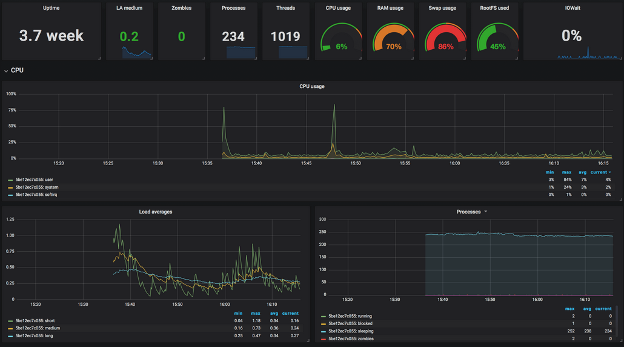
A Grafana dashboard presenting operational metrics, including CPU activity, system performance, and network statistics, through a unified monitoring interface.
Our Implementation Approach
Assess
Identified monitoring requirements, infrastructure sources, critical metrics, dashboards, and alerting priorities.
Collect
Installed Telegraf on Linux and Windows servers and configured plugins for applications, cloud services, and containers.
Store
Configured InfluxDB for time-series data storage, retention management, and high-throughput queries.
Visualize
Created Grafana dashboards for infrastructure health, application performance, and business KPIs.
Integrate
Connected Prometheus and existing monitoring tools and configured notification channels for operational alerts.
Scale
Implemented Kubernetes-based deployment, redundancy, load balancing, and data management optimizations.
Technical Challenges & Solutions
Overcoming Complex Monitoring and Data Integration Challenges.
Multiple Data Sources
Challenge: Consolidating metrics from cloud infrastructure, on-premises servers, applications, and containers into one monitoring environment. Solution: Configured Telegraf plugins and custom integrations to aggregate metrics from multiple sources and display them through unified Grafana dashboards.
High-Volume Time-Series Data
Challenge: Managing increasing metrics volumes without affecting database performance or storage efficiency. Solution: Optimized InfluxDB performance through retention policies, data aggregation, and efficient storage configuration.
Complex Alerting Requirements
Challenge: Defining meaningful alert thresholds across different infrastructure components and services. Solution: Collaborated with the client to fine-tune alert thresholds and configure notifications based on relevant system performance conditions.
Monitoring, Optimization & Handover
Real-Time Insights That Enable Proactive Operations.
Real-Time Infrastructure Monitoring
Dashboards track CPU utilization, memory consumption, disk activity, network performance, and system health.
Intelligent Alerting & Notifications
Grafana alerts notify teams through email, Slack, and PagerDuty when configured performance thresholds are exceeded.
Application & Business Visibility
Custom dashboards consolidate application performance, infrastructure statistics, and business-specific KPIs.
Unified Monitoring Integration
Prometheus and existing monitoring integrations provide additional visibility alongside InfluxDB metrics.
Real-Time System Health & Performance Analytics
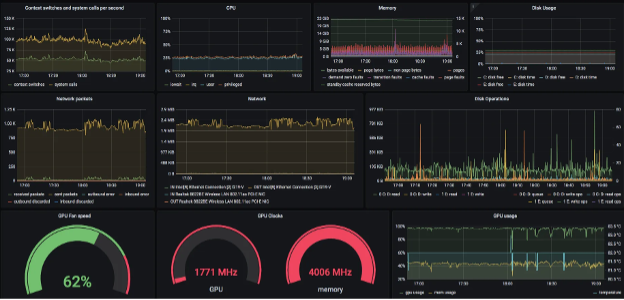
A Grafana monitoring dashboard displaying CPU, memory, disk usage, network activity, and performance trends to support proactive infrastructure management.
Network Traffic & Connectivity Monitoring
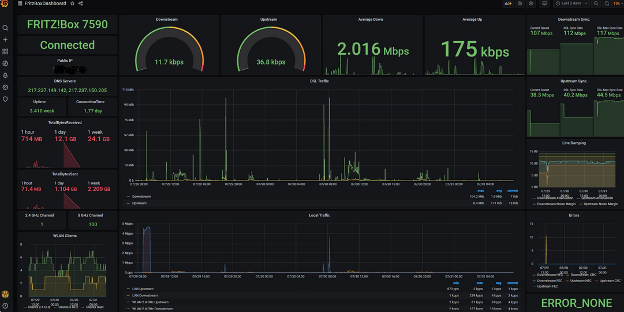
A Grafana dashboard visualizing network throughput, connection status, and traffic patterns to support network performance monitoring and troubleshooting.
Results & Business Impact
Greater Visibility. Faster Response. Scalable Monitoring.
Centralized Monitoring
Unified infrastructure, application, and business metrics through customized Grafana dashboards.
Proactive Incident Detection
Enabled threshold-based alerts to help operations teams identify and respond to performance issues earlier.
Integrated Visibility
Consolidated metrics from cloud, on-premises, containerized, and existing monitoring systems.
Scalable Operations
Established a monitoring architecture designed to accommodate growing infrastructure and data volumes.
Business Impact Summary
The TIG Stack deployment provided the client with centralized, real-time visibility into infrastructure performance, application health, and business KPIs. Proactive alerting and integration with existing monitoring tools improved operational efficiency, supported faster incident response, and reduced duplicated monitoring efforts.
Tools & Technology Used
Grafana
InfluxDB
Telegraf
Prometheus
Docker
Kubernetes
Slack
PagerDuty
Email Alerts
Linux & Windows
AWS / Azure Metrics
Custom API Integrations
Grafana
InfluxDB
Telegraf
Prometheus
Docker
Kubernetes
Slack
PagerDuty
Email Alerts
Linux & Windows
AWS / Azure Metrics
Custom API Integrations
Conclusion
Building a Smarter, More Proactive Monitoring Environment.
The Grafana TIG Stack Integration and Deployment project delivered a scalable monitoring platform that consolidates infrastructure metrics, application performance, and operational alerts.
By integrating Telegraf, InfluxDB, Grafana, and existing monitoring tools, UI Operations enabled improved visibility, more proactive incident management, and a monitoring foundation designed to support future infrastructure growth.
RELATED CASE STUDIES
Explore More Case Studies
LET’S BUILD WHAT’S NEXT
Ready to Gain Complete Visibility Into Your IT Infrastructure?
From infrastructure monitoring and observability to proactive alerting and operational optimization, UI Operations helps organizations build reliable, scalable, and intelligent IT environments.